
Cases

Results measured in real operations

The challenge, the intervention, the transformation and the result of each operation.

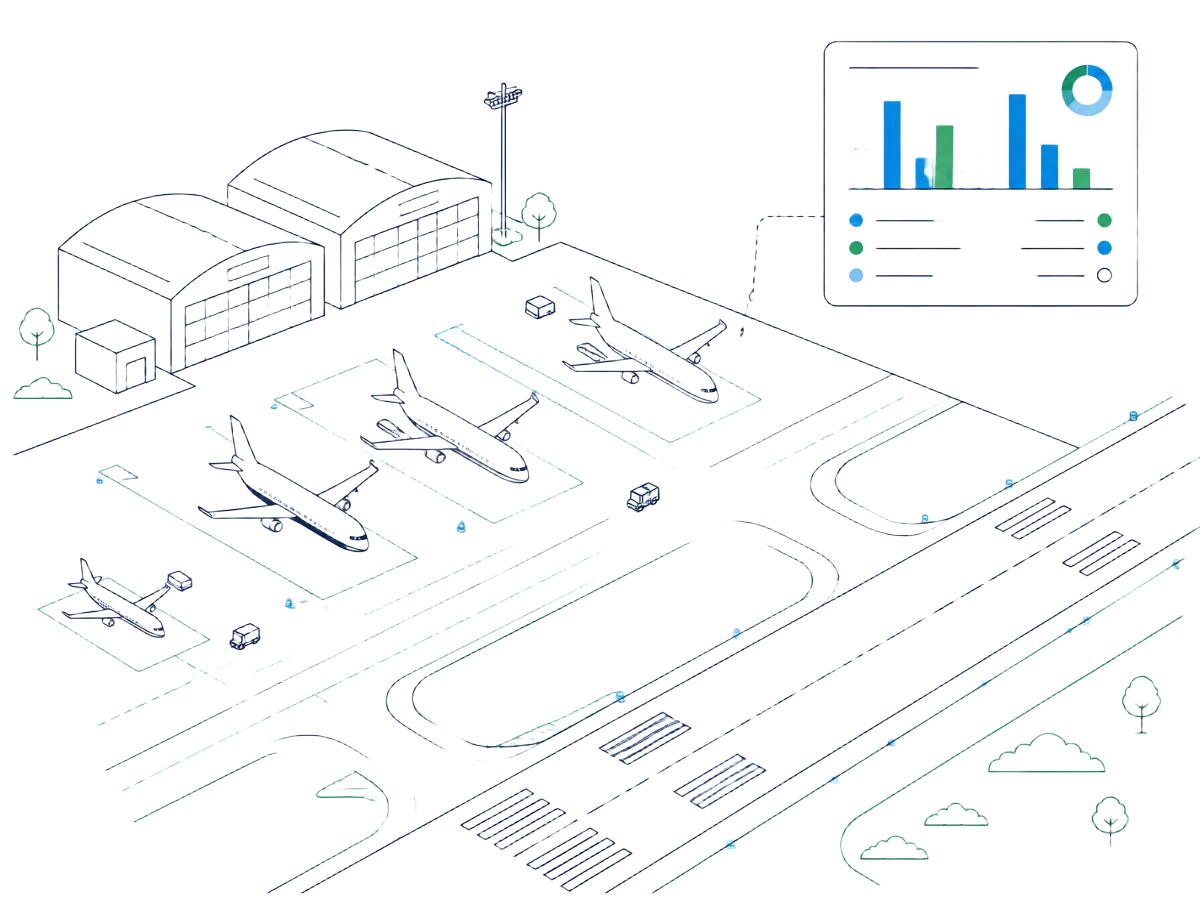
Illustration of an airport apron with performance dashboards

Movement

captured at the source, only once

Revenue

traceable from apron to finance

Performance

comparable across the group

Decisions

supported by reliable data

Executive aviation airport

High value per movement

More movements absorbed with the same operational structure

The challenge

The operation was growing faster than the administrative structure. The structure was managed manually and then recreated for tariffing and billing, consuming the team's capacity in double-checking.

The intervention

  • Movement captured at the source, on the apron, the moment it happens
  • Tariff rules applied directly to the recorded movement
  • Billing generated from operations, with no data recreation
  • Operational and financial indicators on the same base
  • Smart and automated apron orchestration

The transformation

The cycle stopped being a sequence of restarts and became a single chain: what is recorded on the apron is the same data that reaches tariffing, billing and reporting.

The result

  • Re-entry between apron, tariffing and billing eliminated
  • Movement growth absorbed without expanding the structure
  • Closing with less manual reconciliation
  • Continuous traceability from movement to invoice

Multi-airport group

Airport portfolio

A comparable base across the whole portfolio

The challenge

Each airport ran its own process, naming and criteria. Comparing performance required manual consolidation, and every consolidation produced a different number.

The intervention

  • Standardized operational records across airports
  • A single calculation criterion for operational and revenue indicators
  • Portfolio consolidated into one management view
  • Access control by role and by airport

The transformation

Performance conversations stopped being about where the number came from and became about the decision: where to invest, where to correct, where capacity is available.

The result

  • Comparable base across airports, on the same criteria
  • Portfolio consolidation without rework each cycle
  • Deviations identified by comparison between operations
  • Portfolio governance from a single architecture

State concessionaire

Mixed operation, cargo and passengers

Tariff revenue traceable from apron to closing

The challenge

Tariff revenue was reconstructed at closing. Movements without an associated charge and outdated tariff tables only surfaced later, when correction was already harder. And risk situations were only identified during audit processes.

The intervention

  • Versioned tariff tables with controlled effective dates
  • Continuous reconciliation between recorded movement and charge
  • Flagging of movements without an associated charge
  • Audit trail from record to invoice
  • Recording and visibility of imminent risks before the audit process

The transformation

Traceability stopped being a later reconstruction step and became a property of the process, available throughout the month.

The result

  • Tariff revenue traceable end to end
  • Discrepancies handled in operations, not at closing
  • Closing with less manual reconciliation
  • Accountability supported by consistent history

About these results

The results described are operational impacts observed during deployment. Quantitative indicators are presented only when audited with the client.

Bring a modern airport management platform to your market

See how Auter can operate in your country — built for real operational complexity and ready to scale with airport groups and regional networks.